Building a Blue Team Homelab: Wazuh, Sysmon, and What Broke Along the Way
A Wazuh + Sysmon detection lab, and the disk-full cascade that took it down: a rejected agent enrollment that traced back to a filesystem at zero bytes free, then to a deleted OpenSearch security index.
Part 1 of a series on detection engineering practice
Why This Exists
I work in technical support, analyzing email authentication failures and correlating logs. I’m transitioning into security operations. Reading about detection is not the same as running it, so I built a lab where I can generate attacks, watch what the tooling sees, and — more importantly — find out what it misses.
This post covers the build and the failure that taught me the most. If you only want the troubleshooting, skip to The Investigation.
The Architecture
Everything runs on a single Windows 11 machine with 16 GB of RAM, using VMware Workstation.
| VM | Role | Resources |
|---|---|---|
| Ubuntu Server | Wazuh all-in-one: manager, indexer, dashboard | 6 GB RAM, 48 GB disk |
| Windows Server 2022 | Monitored endpoint running Sysmon | 4 GB RAM |
| Kali Linux | Attacker box | 2 GB RAM |
The data flow is straightforward:
Windows Server                    Ubuntu Server
┌─────────────────┐              ┌───────────────────┐
│    Sysmon        │              │  Wazuh Manager    │
│       │           │              │        │           │
│  Event Channel    │  TCP/1514    │  Wazuh Indexer    │
│       └───────────┼─────────────▶│        │           │
│  Wazuh Agent      │  TCP/1515    │  Wazuh Dashboard  │
└─────────────────┘  (enrollment)  └───────────────────┘
Sysmon is a Microsoft Sysinternals tool that logs detailed endpoint activity — process creation, network connections, file changes, registry modifications. Windows logs some of this natively, but Sysmon logs far more, and with better detail.
Wazuh is an open-source SIEM. Agents ship logs to a central manager, the manager applies detection rules, and matches become alerts.
For non-technical readers: Sysmon is the security camera on each machine. Wazuh is the monitoring room where all the footage arrives and gets reviewed against a list of suspicious behaviors.
Part 1: The Build
Wazuh on Ubuntu
Wazuh ships an installer that deploys all three components on one node:
curl -sO https://packages.wazuh.com/4.9/wazuh-install.sh
bash wazuh-install.sh -a
It finishes by printing the admin password for the dashboard. Save it immediately — regenerating it later is more work than copying it now.
Verify the services are listening:
ss -tlnp | grep -E '443|1514|1515|9200'LISTEN 0 128 0.0.0.0:1514 users:(("wazuh-remoted",...)) # agent log traffic
LISTEN 0 128 0.0.0.0:1515 users:(("wazuh-authd",...)) # agent enrollment
LISTEN 0 511 0.0.0.0:443 users:(("node",...)) # web dashboard
LISTEN 0 4096 127.0.0.1:9200 users:(("java",...)) # indexer (local only)The indexer binding to 127.0.0.1 is correct for a single-node deployment — only the local dashboard needs to reach it.
Sysmon on Windows Server
Sysmon’s default configuration logs almost nothing useful. The community configs are what make it valuable. I used SwiftOnSecurity’s, which filters out routine noise and keeps what matters for detection.
From an elevated PowerShell prompt:
mkdir C:\Tools\Sysmon
cd C:\Tools\Sysmon

curl.exe -L -o Sysmon.zip https://download.sysinternals.com/files/Sysmon.zip
curl.exe -L -o sysmonconfig.xml https://raw.githubusercontent.com/SwiftOnSecurity/sysmon-config/master/sysmonconfig-export.xml

Expand-Archive -Path Sysmon.zip -DestinationPath C:\Tools\Sysmon -Force

.\sysmon64.exe -accepteula -i sysmonconfig.xml
Confirm it’s collecting:
sc.exe query sysmon64
Get-WinEvent -LogName "Microsoft-Windows-Sysmon/Operational" -MaxEvents 5
Connecting the Two
A note on VMware networking, since this trips people up: NAT mode in VMware is not per-VM isolation. All NAT VMs share one virtual switch and can reach each other. (VirtualBox behaves differently — its default NAT does isolate VMs, and you need NAT Network or a host-only adapter instead.)
Installing the agent:
curl.exe -L -o wazuh-agent.msi https://packages.wazuh.com/4.x/windows/wazuh-agent-4.9.0-1.msi

msiexec.exe /i wazuh-agent.msi /q WAZUH_MANAGER="192.168.206.138" WAZUH_AGENT_NAME="win-server"

NET START WazuhSvc
The agent doesn’t read Sysmon’s event channel unless you tell it to. Add this to C:\Program Files (x86)\ossec-agent\ossec.conf, inside <ossec_config>:
<localfile>
  <location>Microsoft-Windows-Sysmon/Operational</location>
  <log_format>eventchannel</log_format>
</localfile>
Restart the service, and the agent should appear on the manager:
/var/ossec/bin/agent_control -lThat’s the theory. Here’s what actually happened.
Part 2: The Investigation
The Symptom
The agent installed cleanly and the service ran. But the log looped:
wazuh-agent: INFO: Trying to connect to server ([192.168.206.138]:1514/tcp).
wazuh-agent: INFO: Closing connection to server ([192.168.206.138]:1514/tcp).
wazuh-agent: INFO: Requesting a key from server: 192.168.206.138
wazuh-agent: INFO: Waiting for server reply
wazuh-agent: ERROR: Duplicate agent name: win-server (from manager)
wazuh-agent: ERROR: Unable to add agent (from manager)
Reasonable enough — I had rebuilt the Windows VM, so a stale registration would explain it. Delete the old entry and retry.
Except the manager disagreed:
/var/ossec/bin/manage_agents -l
** No agent available. You need to add one first.
Zero agents registered. The manager was rejecting a duplicate of something that didn’t exist.
For non-technical readers: A hotel tells you your room is already taken, then shows you a guest register with no names in it. Either the register is wrong or the front desk can’t read it — but something is broken beyond “that room is occupied.”
Ruling Out the Boring Things
Cheap checks first.
Network?
ping 192.168.206.138              # timed out
Test-NetConnection -Port 1514     # TcpTestSucceeded: True
Ping failing while TCP succeeds is expected — Windows Firewall blocks ICMP by default. Port 1514 was reachable. Ruled out.
Services? The ss -tlnp output above showed all four ports listening. Ruled out.
So: manager up, reachable, no agents registered, still rejecting enrollment. The agent’s log had told me everything it knew. Time to read the manager’s.
Finding It
tail -30 /var/ossec/logs/ossec.logwazuh-modulesd:syscollector: ERROR: sqlite: database or disk is full
wazuh-db: ERROR: DB(000) Error updating rootcheck PM tuple on SQLite database
wazuh-analysisd: ERROR: FIM decoder: Bad response from database
wazuh-monitord: CRITICAL: (1107): Could not create directory 'logs/wazuh/2026'
due to [(28)-(No space left on device)].df -hFilesystem Size Used Avail Use% Mounted on
/dev/mapper/ubuntu--vg-ubuntu--lv 24G 24G 0 100% /Zero bytes free.
The Chain of Causation
Bottom to top:
- The root filesystem filled up. The Wazuh indexer stores alert data and downloads multi-gigabyte vulnerability feeds — it grows quickly.
wazuh-dbcould no longer write toglobal.db, the SQLite database that holds agent registrations.wazuh-authdattempted to insert the new agent, the write failed, and it returned a generic rejection.- That rejection reached the agent as
Duplicate agent name. manage_agents -lreadsclient.keys— another file the manager couldn’t write — so it reported nothing.
The error described a failed database write, not a name collision.
Lesson 1: An error message tells you what a component decided, not necessarily why. When the message contradicts observable state, trust the state and read logs from the component that generated the error, not the one that reported it.
Part 3: The Fix, and Two Mistakes
Mistake One: Assuming a Warning Was Cosmetic
Ubuntu Server’s guided LVM installer has a behavior worth knowing: it allocates only part of the disk to the logical volume by default, leaving the rest unassigned in the volume group.
vgsVG #PV #LV #SN Attr VSize VFree
ubuntu-vg 1 1 0 wz--n- <48.00g 24.00g24 GB unused, no VMware changes needed:
lvextend -l +100%FREE /dev/ubuntu-vg/ubuntu-lvSize of logical volume changed from <24.00 GiB to <48.00 GiB.
/etc/lvm/archive/...: write error failed: No space left on deviceThe resize reported success; the metadata backup failed. I read that as cosmetic and continued:
resize2fs /dev/ubuntu-vg/ubuntu-lv
The filesystem is already 6290432 (4k) blocks long.  Nothing to do!
6290432 × 4K = 24 GiB. The extension hadn’t persisted.
Lesson 2: You cannot fix a full disk with an operation that itself requires disk space. Free space first, then resize.
The working sequence:
# Free enough for LVM to write its metadata
journalctl --vacuum-size=50M
apt clean
rm -rf /var/lib/apt/lists/*

# Then extend
lvextend -l +100%FREE /dev/ubuntu-vg/ubuntu-lv
resize2fs /dev/ubuntu-vg/ubuntu-lv
df -h /
(Side effect worth flagging: clearing /var/lib/apt/lists/ means apt install will fail until you run apt update. I hit that later trying to install an SSH server and briefly thought the repositories were broken.)
Mistake Two: Deleting a Directory Without Knowing What Was In It
While hunting for space, I had also cleared the indexer’s data directory:
rm -rf /var/lib/wazuh-indexer/nodes/0/indices/*My reasoning: fresh lab, the indexed alerts have no value.
The reasoning was wrong. The Wazuh indexer is OpenSearch underneath, and that directory holds more than alert data — it holds .opendistro_security, the index containing users, roles, and permissions. Deleting it doesn’t clear stale data; it removes the authentication backend.
[ERROR][o.o.s.a.BackendRegistry] [node-1] Not yet initialized
    (you may need to run securityadmin)
[ERROR][o.o.s.c.ConfigurationLoaderSecurity7] [node-1] Failure
    No shard available for ... (index=.opendistro_security)
The dashboard returned Wazuh dashboard server is not ready yet. The process ran but rejected every authenticated request.
The documented recovery is securityadmin.sh, which reloads security config from files on disk:
cd /usr/share/wazuh-indexer/plugins/opensearch-security/tools/

OPENSEARCH_JAVA_HOME=/usr/share/wazuh-indexer/jdk ./securityadmin.sh \
  -cd /etc/wazuh-indexer/opensearch-security/ \
  -nhnv \
  -cacert /etc/wazuh-indexer/certs/root-ca.pem \
  -cert /etc/wazuh-indexer/certs/admin.pem \
  -key /etc/wazuh-indexer/certs/admin-key.pem \
  -h 127.0.0.1 \
  --accept-red-cluster
Every write timed out:
FAIL: Configuration for 'actiongroups' failed because of SocketTimeoutException
FAIL: Configuration for 'tenants' failed because of SocketTimeoutException
The cluster was red, no shards available, writes hanging indefinitely.
Lesson 3: “It’s just a lab, nothing of value here” is a judgment about data. Configuration and state frequently live beside the data they describe. Know what’s in a directory before deleting it.
Part 4: Knowing When to Rebuild
By this point the cascade was: disk full → corrupted database → deleted security index → unrecoverable cluster. Each fix exposed the next problem.
A clean reinstall on the now-48 GB disk takes about fifteen minutes.
bash wazuh-install.sh --uninstall

rm -f wazuh-install.sh
curl -sO https://packages.wazuh.com/4.9/wazuh-install.sh
bash wazuh-install.sh -a
(On my version, passing -o returned ERROR: No configuration file found. Flags don’t always carry between versions — --help is cheaper than guessing.)
Re-enrolling the agent, which now had an invalid key:
cd "C:\Program Files (x86)\ossec-agent"
.\agent-auth.exe -m 192.168.206.138 -A win-server
NET STOP WazuhSvc
NET START WazuhSvc
Lesson 4: Repair time is justified when the thing being repaired holds something you can’t rebuild. In a lab, it rarely does. Knowing when rebuilding beats repairing is a skill, not an admission of defeat.
Part 5: Verification
Bottom-up, rather than trusting one green checkmark:
# 1. Services running
systemctl status wazuh-indexer wazuh-manager wazuh-dashboard --no-pager

# 2. Cluster health — green or yellow (yellow is normal on a single node,
#    since replica shards have nowhere to go)
curl -k -u 'admin:PASSWORD' https://127.0.0.1:9200/_cat/health?v

# 3. Disk headroom
df -h /

# 4. Agent registered
/var/ossec/bin/agent_control -l
ID: 000, Name: monitor (server), IP: 127.0.0.1, Active/Local
ID: 002, Name: win-server, IP: any, ActiveConfirming the Sysmon block survived the agent reinstall:
Select-String -Path "C:\Program Files (x86)\ossec-agent\ossec.conf" -Pattern "Sysmon"And generating something that would actually trigger a rule — encoded PowerShell, a common obfuscation pattern:
powershell.exe -EncodedCommand dwBoAG8AYQBtAGkAIt registered. Within a day the agent dashboard showed MITRE ATT&CK detections across Discovery, Execution, and Command and Control, plus a CIS Windows Server 2022 benchmark scan: 125 passed, 232 failed, 35% score.
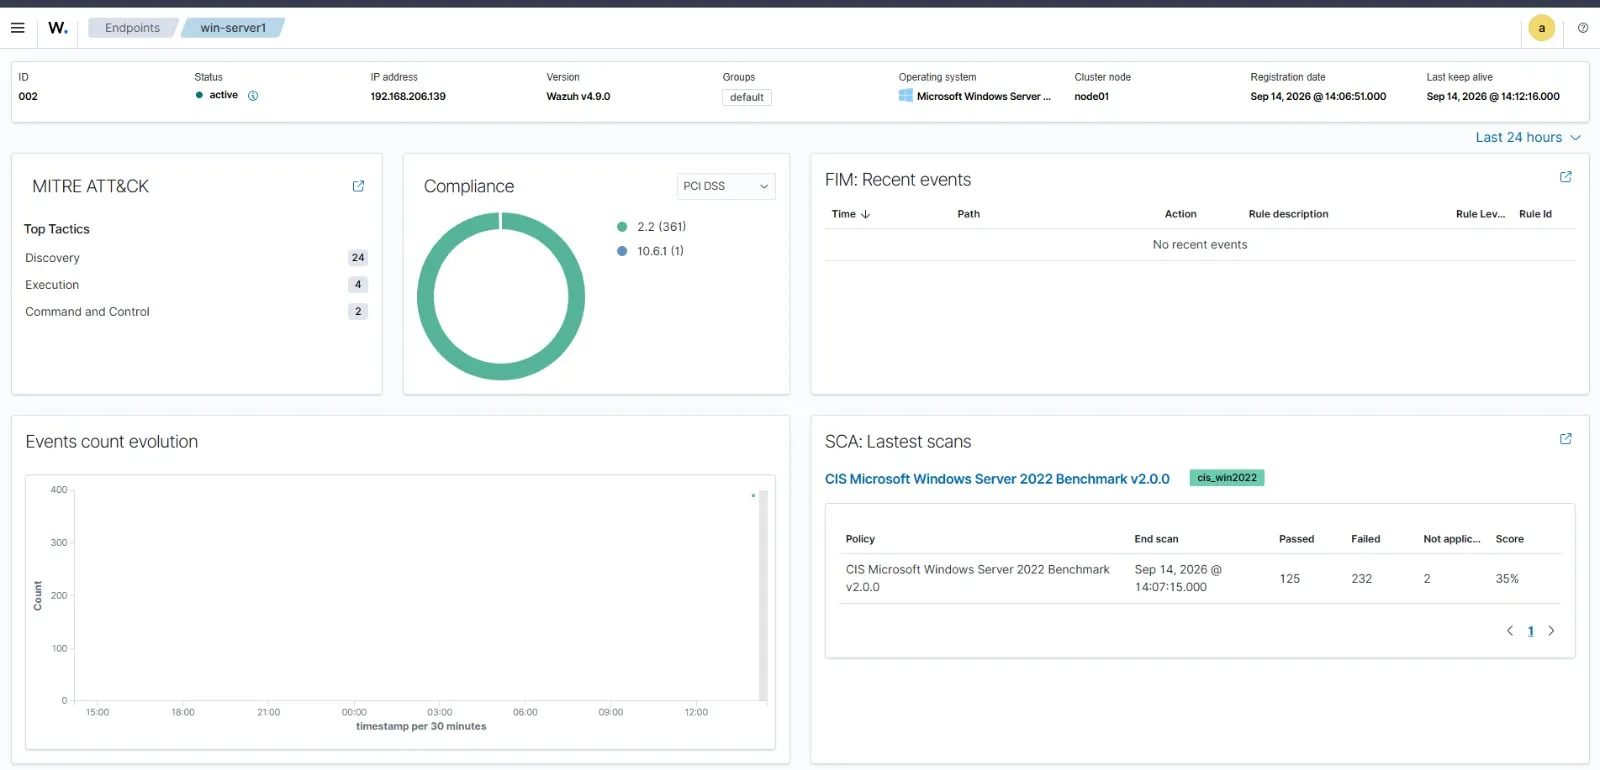
That 35% isn’t a problem to fix so much as a backlog to work. A default Windows Server install always scores poorly against CIS — triaging and prioritizing those 232 findings is its own exercise.
Takeaways
On troubleshooting:
- When an error message contradicts observable state, it’s describing a downstream effect. Read the logs of the component that generated the error.
- Check the boring causes first. Disk, memory, permissions, and DNS account for a large share of “mysterious” failures.
- Eliminate possibilities in order of cost. Ruling out the network took two commands.
On Wazuh specifically:
- All-in-one deployments need real disk. 24 GB is not enough with the indexer and vulnerability feeds running. Budget 50 GB minimum.
- Ubuntu Server’s LVM installer may leave half the disk unallocated. Run
vgsbefore assuming you need a bigger virtual disk. /var/lib/wazuh-indexer/nodes/0/indices/holds the security configuration index, not just alert data.- VMware NAT places VMs on a shared switch; VirtualBox NAT does not. Know which you’re using before debugging connectivity.
On the process:
The most useful part of this build wasn’t getting Wazuh running. It was the gap between what the error said and what was actually wrong. That gap is where analysis happens. In a SOC, an alert tells you what a detection rule fired on — not what happened. Same discipline, different context.
What’s Next
The infrastructure is up. The lab as a learning exercise is just starting:
- Integrating the Kali VM to generate deliberate attack traffic
- Running Atomic Red Team techniques and documenting which Wazuh detects by default and which slip through
- Writing custom detection rules in
local_rules.xmlto close the gaps - Adding OPNsense for network segmentation and firewall logging
The gaps are the interesting part. A tool that catches everything in a tutorial and nothing in practice is worth knowing about before you’re relying on it.